ImageJ: Tipps and Tricks
The following section provides some tipps and tricks for the usage of ImageJ.
Same Scale for LUT images
Introduction
We apply a comparable evaluation to
The volumes are 8-bit-stacks from any kind of segmentation. For the color code, which will be rendered to the surface, we use the local thickness output of Bob Dougherts’s 3D Distance Transformation implementation.
The local thickness stacks are 32-bit-stacks. The VolumeJ plugin requires a 8-bit-stack color map. If you just convert the 32-bit-stacks to 8-bit-stacks, then every image of your project probably has a different scale for the LUTcode.
The following description shows one way to get the same color scale for all samples of your project.
How to set the same color scale for several samples
You should determine the minimum and maximum values which you want to color code in your project.
For ease of explanation I suggest to open all distance transformation images and determine their maximum.
Then you use for the 32-bit-images: Image > Adjust > Brightness > Set: Min = your minimum value, Max = your desired maximum value. Then you can check: “Propagate through all Images” and apply this adjustment to all relevant images. Afterwards you convert all images to 8bit. Now all 8bit stacks for the VolumeJ thickness rendering will have the same scale.
Scale Bar in ImageJ
Introduction
You can scale ImageJ pixels to metric units. We use microcomputed tomography images usually. These images can be scaled already to metric units during their import with KHKs_Scanco_ISQ_FileReader . If you do not check this option you can add it later with the following commands.
Scale Images and Add a Scale Bar
Let us assume that one voxel has the dimensions 32 µm x 32 µm x 32 µm.
To scale the stack do:
Analyze/Set Scale and give Distance in pixels = 1, Known Distance = .032, Pixel Aspect Ratio = 1, Unit of Length = mm
Add the scale bar with Analyze/Tools/Scale Bar and make it for example 2mm long, font 12 pt, not bold, position lower left (or whatever you like).
Add a Legend to ImageJ LUT Images
This hint follows advice from Bob Dougherty:
It is made with Tools/Calibration bar. If you are not working with a 32bit image, make a dummy image with File/New/Image…. Make it 32 bit and 256x256x1. The Fill With choice does not matter, but choose Ramp.
Select the LUT, which you want to apply, with Image/Lookup Tables -> Fire (just as an example). Set the range of displayed values in the dummy image to (approximately) match the data in the real image (the image is scaled from 0 - 1, to apply the same scale as the image for which the scale is developed, multiply with Process > Math the whole image with the maximum value of the image under test). Then select the dummy image and do Image/Adjust/Brightness/Contrast… In this dialog, choose Set and set the Minimum displayed value to 0 and the Maximum Displayed Value to 0.5.
Create a legend for the dummy image with Analyze/Tools/Calibration Bar….Set Decimal Places to 1.
Experiment with Number of Labels until it looks right (2 and 6 work well here). Set the Font size to 12 to match the scale, zoom 1, and choose OK.
We need to add a label of mm to this scale. Set the background color to white by selecting the eyedropper tool and alt-clicking in the white box. Make a rectangular selection of the scale and the numbers, do a cut and paste (clicking in between to remove the ROI), to position it to the left of its original location to create white space on the right. Set the foreground color to black and add the “mm” with the text tool (First set the font size to 12 with Edit/Options/Fonts…).
Now make a rectangular selection that includes the legend and white space,and paste it into your image of choise for the legend. Set the background color to black and adjust the positions of the scale and legend. Crop the image and Save As.
Render a volume and project color coded thickness data to the surface
Introduction
To illustrate this technique I will use data from a cooperation with Roman Khonsari, a maxillofacial surgeon from France who is currently (2010/2011) working on a PhD in craniofacial development at King’s College London. His project includes the study of a series of skulls from South America with intentional cranial deformations .
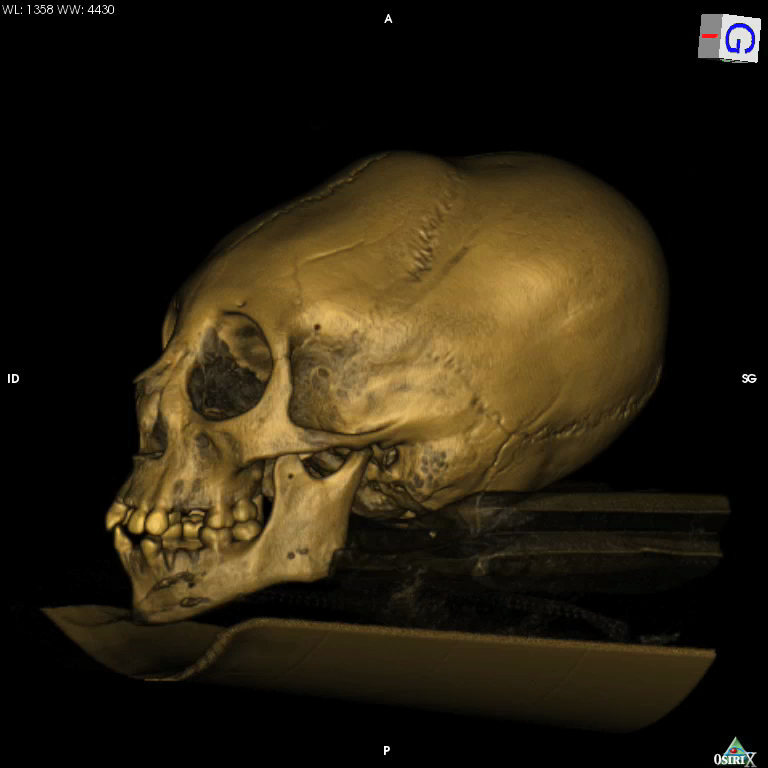
It was particularly interesting to measure the thickness of the vault of these individuals and map this thickness over the surface of the vault.
You can download a set of sample data here: Data and video animation
Volume rendering and thickness projection
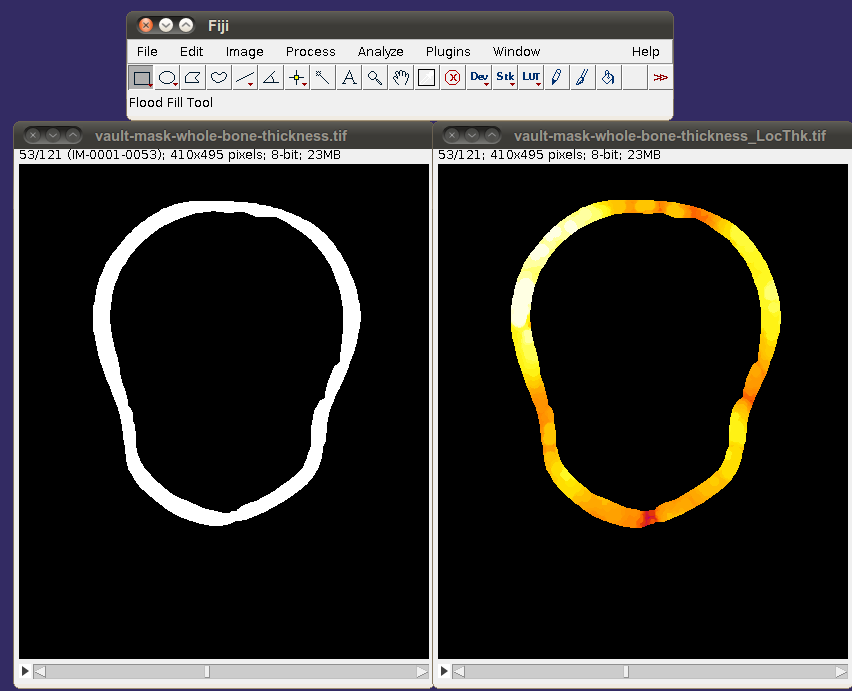
I used two stacks to project the underlying local thinkness onto the rendered surface of the volume.
Stack no. 1 is the volume which should be rendered. I used a binarized stack. The elements of the volume were 255 and the background was 0.
Stack no. 2 contains the data which are projected onto the surface of the rendered volume (in this case the local thickness map).
The two stacks are the input for the plugin
To make thinking easier I turn, flip and rotate the stacks into the desired orientation before I input them into VolumeJ (using TransformJ)
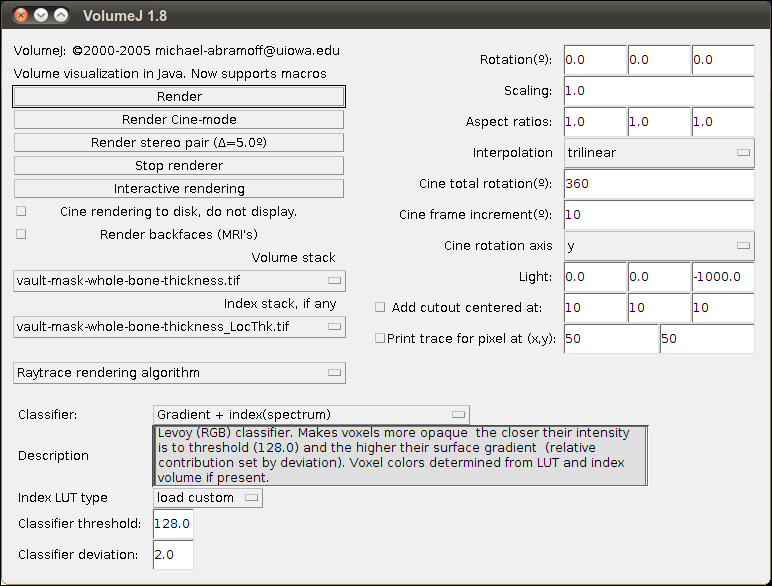
The documentation of VolumeJ is hard to understand therefore after some trial and error I found the settings which did the job for me. To remember I made a screen shot of the settings.
To project the local thickness to the volume surface it is necessary to select for Classifier: Gradient + index(spectrum). As the LUT I prefer the LUT “FIRE” to the LUT “SPECTRUM” (the default). If the path to the LUT is not recognized properly, copy the LUT from the ImageJ/lut directory (for example: Green Fire Blue.lut) to the same directory where your data reside).
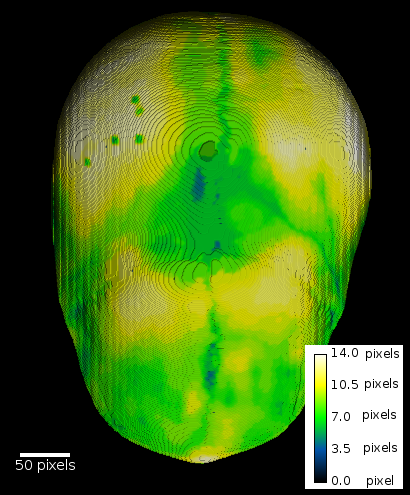
The final result including scale bar and legend looks like this: